
Maintaining data quality is an ongoing issue that affects many businesses. Millions of dollars of budget are wasted every year because of poor data quality. Companies rely on accurate data to assist their marketing, sales and customer service efforts. If the marketing department doesn’t have the right information on their customers, they could waste precious time chasing leads that don't exist.
Problems with data quality are practically inevitable. Humans, by nature, are prone to making mistakes. Nearly everyone makes the occasional mistake entering information into databases – even the customer may enter their contact details incorrectly which can be difficult to change once in the system. It's essential that companies take action to protect the quality of their data - if not, the consequences can have a deeply adverse effect on many different teams: Management, teams, and supporting roles all suffer from the effects of poor data quality.
Good Data runs successful businesses
Good quality data is the backbone of all businesses. It should come as no surprise that an overwhelming majority (more than 95%) of U.S. organizations say that they use data to power business opportunities. And if that’s not enough, another 84% of U.S. organizations say that they believe data is an integral part of forming a business strategy. Below is a breakdown chart detailing how data powers business opportunities:
How data powers business opportunities:
- Increase revenue – 61%
- Better serve customers – 56%
- Enhance marketing efforts – 39%
- Reduce Risk – 36%
- Find new revenue streams – 36%
- Enhance new initiatives – 35%
- Comply with government regulations – 32%
Key aspects of Data Quality:
- Accuracy - Data must be properly valued by business transactions.
- Consistency - Any data must be consistent with other ones throughout all its lifecycle.
- Uniqueness - No duplicates, either multiple instances of the same data identifier or different identifiers associated with the data.
- Integrity - Any data should remain consistent with management rules: regarding mandatory and optional attributes, and other business rules.
- Availability - Data must be available whenever user needs access to it.
- Traceability - Data changes are recorded in an audit trail enterprise facility.
- Completeness - Data must figure all instances of entities.
- Compliance - Data representation is consistent with norms and standards of industry or in force in the enterprise.
- Freshness - Data must reflect the current state is no lag or delay.
- Intelligibility - Data characteristics and description of different states of life cycle must be obvious and easily understood by stakeholders.
The state of the data quality in the enterprise
The 2017 Data Quality Study by Praxata surveyed 290 executives and IT professionals at enterprises with $100M or more in annual revenue. The results show that organizations are struggling with a variety of data quality and data preparation issues as they strive to turn data into valuable business insights that can drive organizations forward.
Key takeaways from the report:
- The companies surveyed are experiencing two major obstacles: significant data variety and complex mix of data types
- 37% of any organization’s data comes from external, second party and third-party sources
- 64% report using mostly structured/little unstructured data, 21% structured/unstructured, and 6% all unstructured data - Data ingestion takes up the majority of the data preparation process time (30%), with data profiling (21%) and data remediation (21%) following close-by.
- The use of Excel or custom coding for data preparation is at very high levels among all data quality maturity levels. This is an indication of a lack of comprehensive functionality and business-friendly tools in existing data quality solutions.
There is a significant performance gap in data quality tools.
While 56% of respondents cited visualization as a very important purchase driver only 33% rated their current visualization tool as very effective. 53% cited usability for business teams as a very important purchasing driver, while only 32% rated their usability as very effective.
51% or respondents cited live interaction with data as very important, while only 28% rated their live interaction with data as very effective.
Tools that support interactivity with structured and unstructured data, are usable for less technical users, have strong embedded visualizations and have performance and scalability in ingesting and prepping large volumes of data are on the buyers’ agenda when investing in data quality.
Data quality, the key to data transparency
IT leaders are at the forefront of controlling the quality and accuracy of their information. Ensuring high data quality is one of the crucial tasks for every Enterprise Architect. A centralized collaborative EAM platform is only as useful as the quality of data that populates it.
What constitutes high data quality?
There are four cornerstones to maintaining a high level of data quality:
1. Ease-of-use
Usability is mandatory for any data capturing tool. The easier it is to use the tool, the more people will accept it and include the tool in their daily work. There are many ways to achieve ease of use, varying from asking for direct feedback, to formulating KPIs, and cataloging how long it takes until a new user feels comfortable with using the tool.
Possible KPIs:
- How long does it take until a new user can use the tool? Be sure to ask the slowest candidate, not the expert.
- How much documentation is required?
- How long does it take to execute basic transactions, e.g., create a new application?
Once you formulated these KPIs, take the necessary steps to change them.
2. Leave out everything that does not create value
One aspect of usability deserves particular attention. EA initiatives have long been known to collect any data that might help them in the future, which may not be needed at the time of recording. Team members may ask the question: "Why do I need this data record?" If you cannot give them a satisfying answer, be aware that team members may not maintain a certain record. Consider reassessing the need and use of particular records.
3. Sensible governance
Governance might not be sexy, but without it, your data will become unusable sooner or later. Successful companies find smart ways of combining governance with other cornerstones, including clear conventions on which data to enter or defined milestones to enter data, e.g., project gateways or definition of done in Scrum. On a more sophisticated level, a lean quality management system helps the “gardeners” of the EA data to keep it regularly up-to-date. Such a quality management system should be supported by the EAM platform. 
4. Smart automation
Companies already hold a host of data, ranging from master data, intelligence data, business data, e.g., customer or product data, to project information, to operational information. Operation data are tools used for development or operating, e.g., Docker, but also tools that hold information on response time, system availability, or issues occurred. Automating the data exchange is two-fold. On the one hand, the obvious advantage of connecting dots automatically is that no manual maintenance is needed, and that automated data cannot deteriorate. On the other hand, however, data automation projects can be tedious and often do not keep their promise. It is one main task of the EA to decide which data is required automatically to create business value, and for which data manual synchronization is sufficient. Keep in mind the second point as well. In many cases, you will find out that you do need a certain data record.
When you are choosing your tool, choose the best tool for each challenge. Companies tend to have supporting tools already in their arsenal, be it for project management or operative monitoring. Companies may choose to combine and integrate these top class tools with open APIs, which avoids redundant data capturing, and gives organizations a high level of flexibility to use the best tool in each industry. It is improbable to predict exactly which data will be needed a year from now, so invest in the best platforms at the time, and do not sacrifice the opportunity to integrate data once you need it.
LeanIX as a Data Quality and Information Management Solution
LeanIX provides several features to keep track of your data quality and completeness. Businesses need an information management tool that can support interactivity with data, ingest and prepare large volumes of data, and allows business users as well as technical staff members to become more fully engaged in data quality initiatives. LeanIX enables business users – whom, by nature, have less technical knowledge, but know the context and meaning of data better than technical users, to visually explore, transform, and publish contextual and clean data for analysis everywhere.
There are a couple of features in LeanIX to help you maintain high data quality. Learn how to:
- Configure completeness for the individual Fact Sheets to distinguish between mandatory and optional fields
- Use the Quality Seal to combine collaborative editing with a rigid governance process
- Use the Survey add-on to actively approach stakeholders to provide and maintain data
Fact Sheet Completeness
Making sure the mandatory data of a Fact Sheet is completed is the first step towards high data quality. For each Fact Sheet element, LeanIX allows you not only to distinguish between optional and mandatory, with LeanIX Pathfinder you can even set your individual weight for each element. The quality of information is sometimes decisive for the acceptance of EAM at one's organization. In LeanIX the quality of data is computed automatically on the basis of a few indicators / automated values.
1. Completeness Level
All relevant sections as defined in the Administrator area are included into completeness calculation. Completeness calculation is now adjustable in Pathfinder so that the overall completeness may reach 100 % even if certain fields are not filled.
2. Last Edit Date
The last edit date shows the actuality of the data.
3. Check Fact Sheet Quality Seal
A *bell symbol* will appear to show that the Fact Sheet content may be not quality assured. This could be either the case if the end of the reminder period has been reached or somebody not responsible for that Fact Sheet has edited some data. The Administrator per Fact Sheet Type can set a check reminder period.
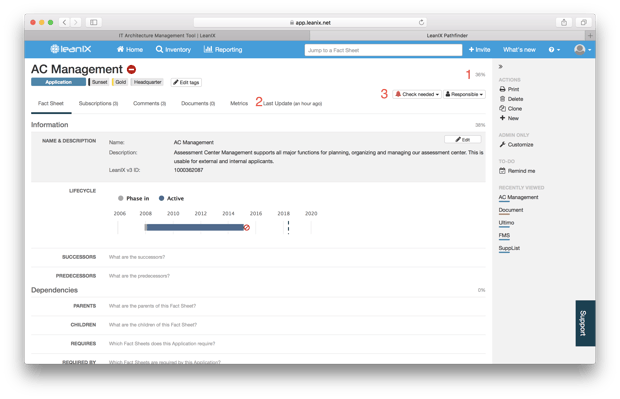
Figure 1: LeanIX Fact Sheet
How to configure completeness for Fact Sheet Types
The completeness can be configured by workspace administrators without involving LeanIX support. There are two ways to configure this:
- Go to the administration menu > Fact Sheet Definition
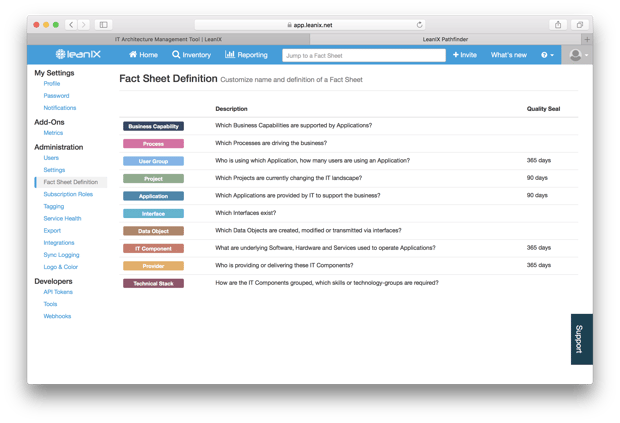
- Open the Fact Sheet you want to edit > Customize Fact Sheet > Advanced

In this table, you have two dropdowns for each Fact Sheet section:
- Weight: The weight controls whether this section is counted in the completeness calculation. Set it to "1" to include the position into the calculation, set it to "0" to leave it out of the calculation. If you feel that a particular section is of higher importance, you can also use higher numbers for your most important sections.
- Status: It is good practice to deactivate any section which is not in use in order to make life easier for your stakeholders. Those sections are still accessible, e.g., via API, and any data already stored will, of course, remain present.
Quality Seal
The quality seal is a great mechanism to combine collaborative editing with clear responsibilities and a rigid governance process. The main concept is very simple:
- As a Fact Sheet responsible or accountable, you are tasked to approve the quality of a Fact Sheet (see below).
- If somebody else who is not responsible (or administrator) changes your Fact Sheet (e.g., an attribute, a relation), the quality seal breaks and you get a mail.
- Also, your workspace administrator can configure a certain time period (e.g., 30 days). This implies that after this period, your quality seal automatically breaks, helping you to continuously maintain the quality and up-to-dateness of your Fact Sheet.
Be sure to note: The Quality Seal is not available in all LeanIX editions. Contact your Administrator or get in touch in case you are unsure whether the feature is available on your workspace.
How to configure the Quality Seal
As an administrator, go to the Fact Sheet Definition page.
For each Fact Sheet, you can choose between the following options:
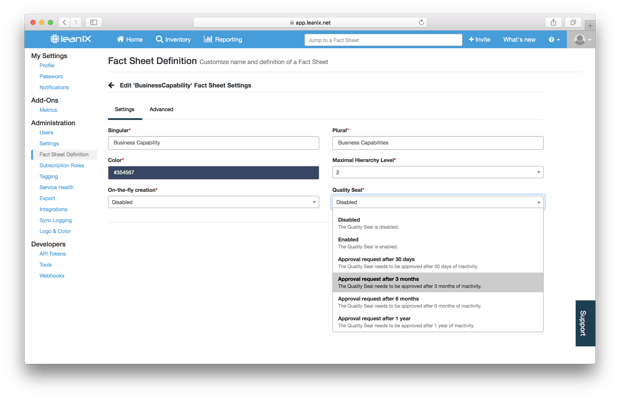
- Disable the Quality Seal
- Enable it, i.e., the Seal breaks in case of any edit of non-responsibles, but no time period for re-approval is configured
- Enable it and set a time period for re-approval
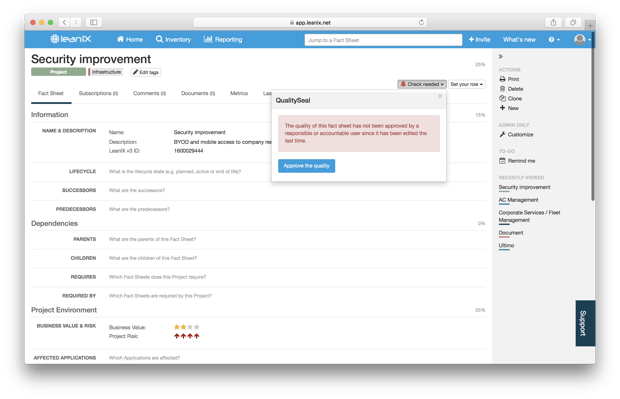
How to set the Quality Seal
For each Fact Sheet where the Quality Seal is enabled, a little button on the top right shows the state (Check needed or not) and allows you to approve the quality.
What happens in case the seal breaks
In case the Seal breaks, all Fact Sheets responsibles and accountables receive a mail. Mails are aggregated if required, i.e. if 10 Seals break at the same day, you receive only one mail.
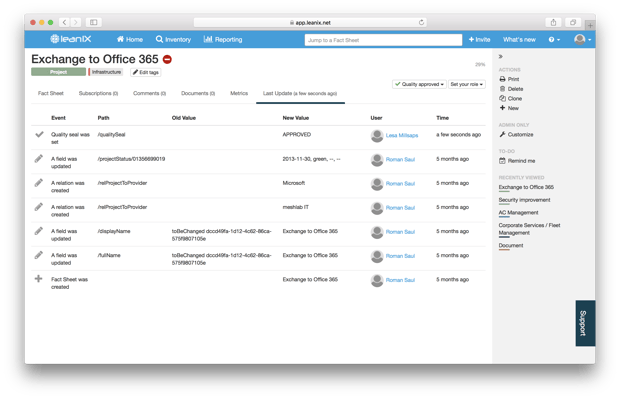
Also, the events (both approval and break) can be traced in the Fact Sheet audit log.
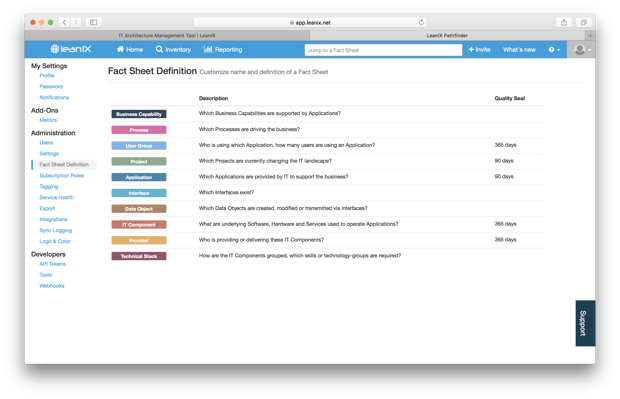
How to filter for Fact Sheets with broken Quality Seal
In the inventory and in the reporting, you can filter for the Quality Seal state. You can combine this filter options with all other Filters.
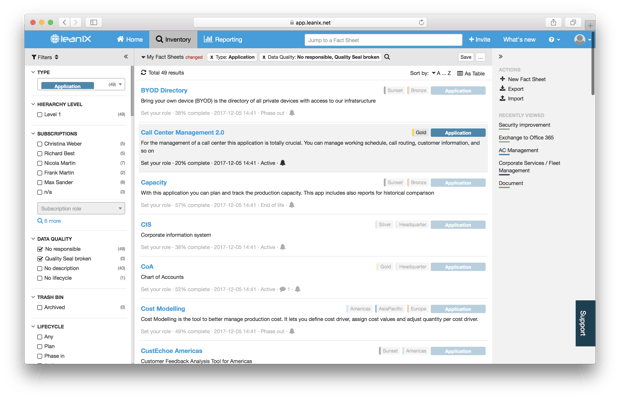
Further, the table view gives you a direct overview where quality seals are set. You can also export it to XLS in one click.
In Conclusion
Companies pursuing digital excellence should put a strong focus on data quality. Businesses today have more data available at their fingertips than at any time in history. Yet, an overabundance of data, especially bad quality data, is counterproductive to good business outcomes. With their holistic view of the enterprise, Enterprise Architects armed with the right tools, are in the optimal position to enhance the integrity of the quality of data to support the business decisions of their teams.